
Sunday, October 18, 2026. Arapahoe Basin.
That’s the call. Confidence: 34 out of 100.
If that number seems low for something I set an entire weekend and an unspeakable quantity of tokens on fire to produce — good. Hold that thought. The low number is the whole point, and getting to it honestly was harder than getting to a high one.
For the East: Saturday, October 31. Killington. Though the East is basically a coin flip on whether it even happens in October, and I’ll explain why that’s not a failure.
The West beats the East 81% of the time. It nearly always does. The East is 26 seasons of Vermont snowmakers politely losing to Colorado altitude.
I want to be careful with that 81%, though, because I got it wrong once already and the model caught me. More on that below.
The last stop on the crazy train
There’s a progression to being a skier in the offseason and it ends somewhere undignified.
It starts innocently. You check the long-range forecast in August. Reasonable. Then you’re reading NOAA discussions in your pajamas. Then you’re in a forum argument about whether Loveland’s snowmaking guns constitute a moral compromise. Then it’s July and you’re pulling the entire Oceanic Niño Index back to 1950 off a NOAA ASCII endpoint at an hour that is either very late or very early depending on your commitments, running permutation tests on a sample size that would make a statistician cough into their hand.
This is not weather forecasting. Let’s be clear about that. This is 2 a.m. fever dreams set to an EDM soundtrack of proof points. It’s the specific delirium where you convince yourself that if you just stack enough legitimate-looking evidence — primary sources! leave-one-out cross-validation! a p-value! — the pile will eventually become knowledge. The drop never comes. You just keep building.
So I built the model. And then the model did something I did not expect: it told me to shut up.
What the thing actually is
It’s called CANTORE — Conditions Analysis and Numerical Tracking for Opening Readiness Estimates.
Yes, I named it after Jim Cantore. Here’s why that’s the right name:
You hate to see Jim Cantore where you are from July to September (Hurricanes). You’d make the man dinner to have him where you are from November through April (Winter Storms).
Same man. Same job. Completely opposite meaning — depending on nothing but the season and which mountain he happens to be standing on. Cantore on your street corner in August means your roof is about to leave. Cantore on your hill in January means the best day of your year is thirty-six hours out. If you have ever felt your entire relationship with weather invert somewhere around the first week of November, you already understand this newsletter and I don’t need to explain the rest of it to you.
There’s a second joke in the name and it’s at my expense. Jim Cantore is the most excitable man in weather — the thundersnow guy, the one who loses his mind on camera in an empty parking lot. CANTORE the model spent its entire existence refusing to get excited about the largest climate signal on the planet. I named it after a man it behaves nothing like.
Stripped down, CANTORE answers one question: when does the first ski area in America spin a lift?
It has three parts.
A base rate. 26 seasons of first-openings, West and East, hand-verified with sources and confidence flags. Not scraped — checked. This part was tedious and it’s the only part that matters. West: mean October 17.8, median October 16, standard deviation 6.5 days, full range October 7 to October 29. That’s a remarkably tight distribution for something ostensibly governed by weather.
A signal layer. ENSO state from primary NOAA sources. Regression on the Oceanic Niño Index, plus an analog composite of past strong El Niño years.
A verification layer. Leave-one-out cross-validation, permutation testing, and a fragility check that asks: if I delete one data point, how much does the answer move?
Here is the whole dataset in one picture — every season since 2000, and where the 2026 call lands.
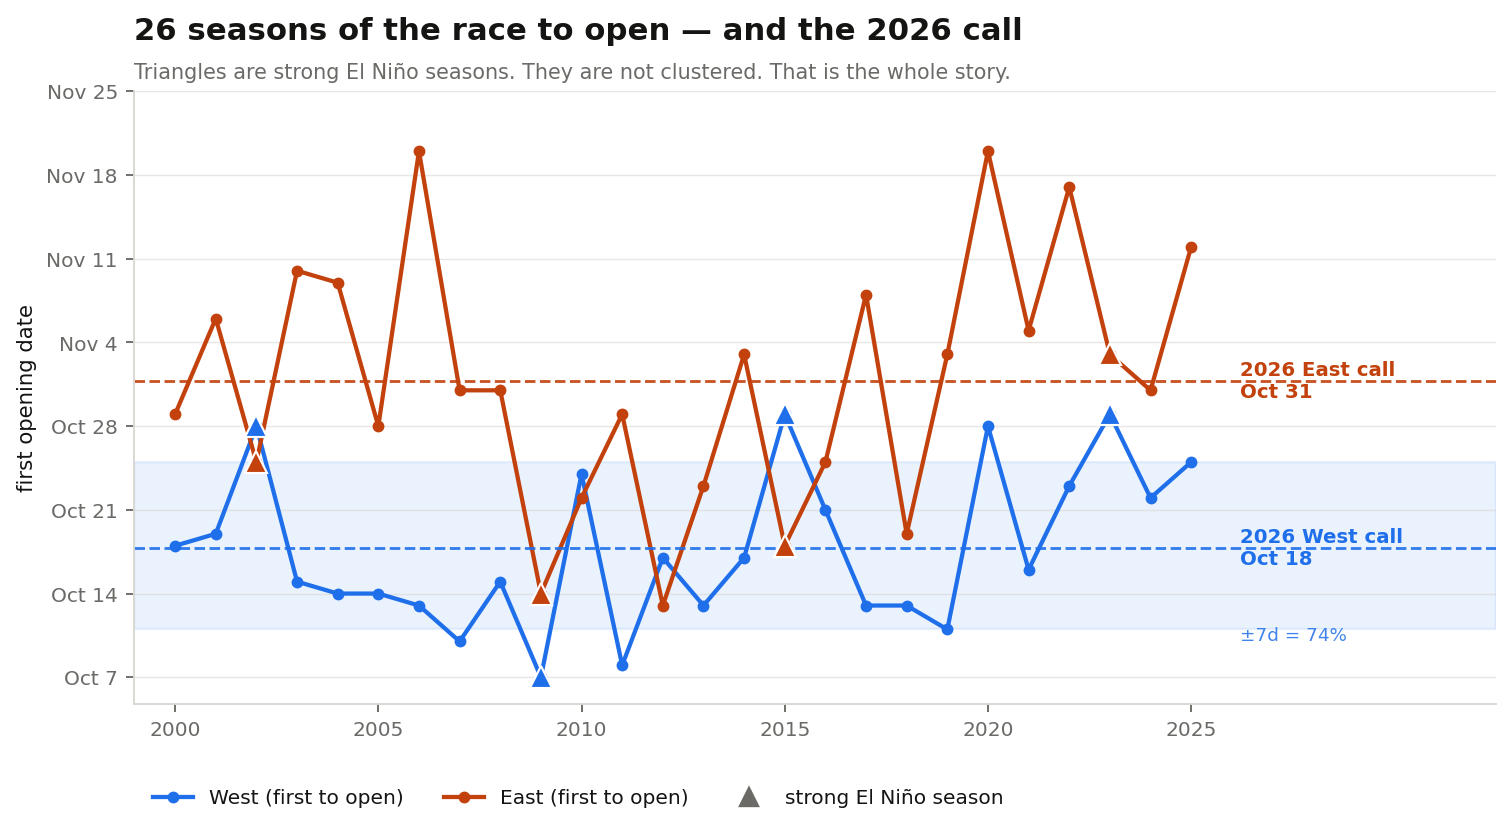
That third part is where the story is.
The El Niño is enormous and it is completely useless
Here’s what I was sure I had.
The CPC discussion from July 9th is not subtle. El Niño Advisory in force. Niño-3.4 sitting at +1.2°C. Niño-1+2 at a genuinely lurid +2.7°C. And an 81% chance of a very strong El Niño during October–December — potentially among the largest events in the record going back to 1950.
Eighty-one percent. Very strong. In the exact three-month window that decides this question.
This is the dream input. This is the thing you build the model for. I had my narrative locked and loaded: monster El Niño, dramatic implications, here’s your date, smash that subscribe button.
Then I tested it.
Leave-one-out cross-validation. Refit the model 26 times, each time hiding one season, and see if the ENSO version beats just predicting the boring historical average.
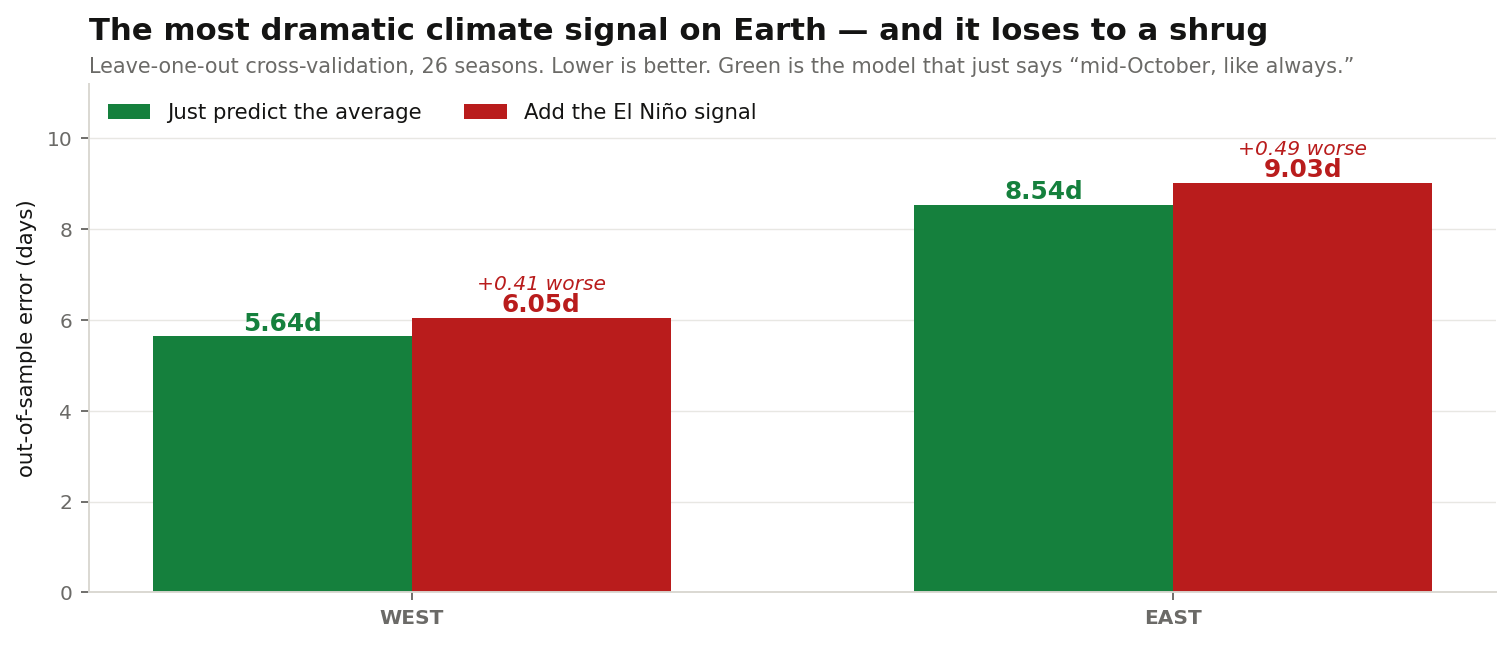
The El Niño term made the forecast worse. In both regions. Not “insignificant.” Not “marginal.” Actively, measurably counterproductive. I gave the model the most dramatic climate signal available on planet Earth and it performed worse than a model whose entire strategy is shrugging and saying “probably mid-October, like always.”
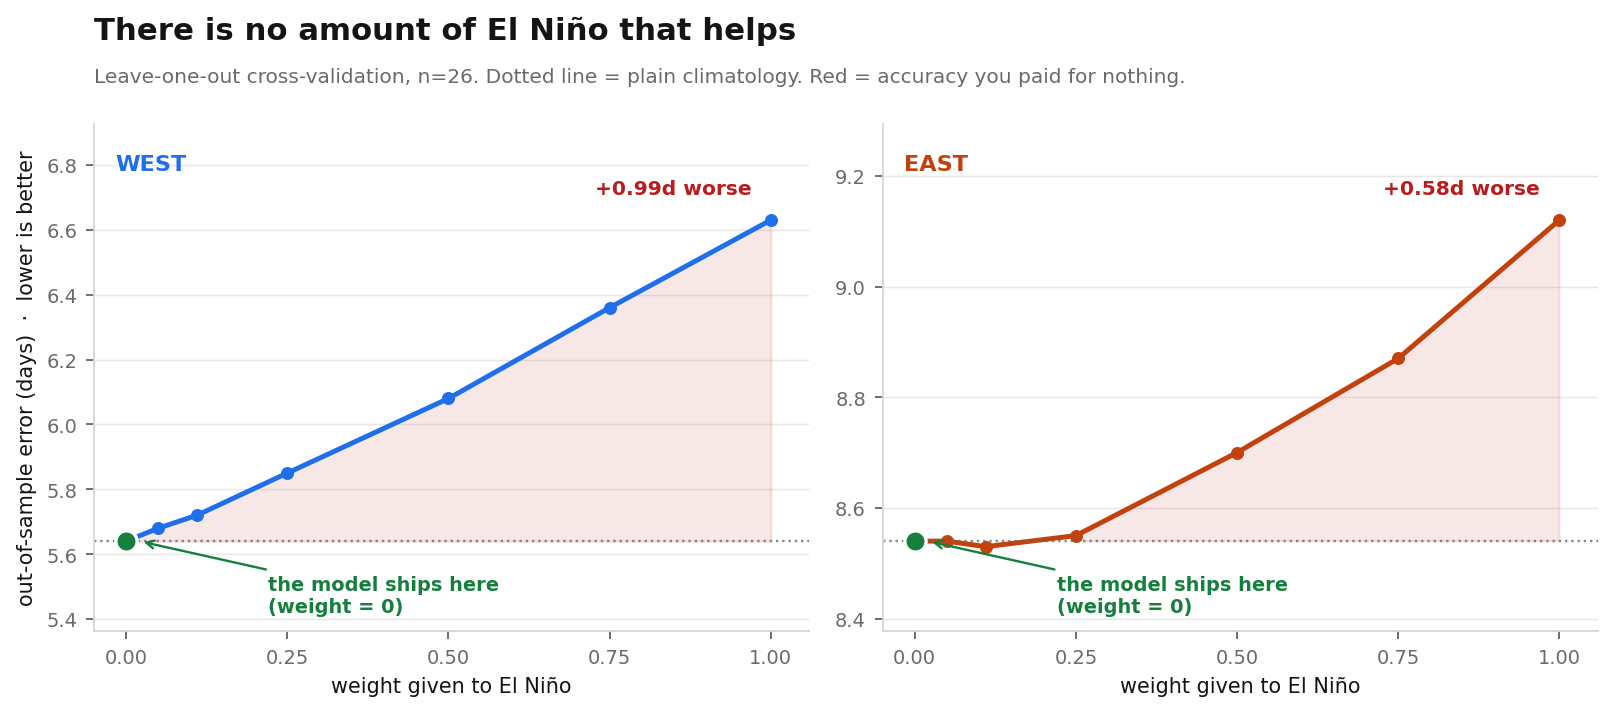
And before you ask whether I just used too much El Niño — no. I swept the weight from zero to one. There is no setting where it helps.
Permutation test. Shuffle the El Niño values randomly 5,000 times, destroying any real relationship, and count how often pure noise produces a correlation as strong as the real one. Answer: 39% of the time in the West. 18% in the East. That’s not a signal. That’s a coin that remembers being flipped.
And then the one that ended the argument. The West regression says El Niño makes openings later. The East regression says El Niño makes openings earlier. Same driver. Opposite signs. There is no physical mechanism in atmospheric science that does that to October snowmaking windows in Colorado and Vermont simultaneously. Two contradictory answers from one cause isn’t a finding — it’s the sound noise makes when you torture it.
The analog composite was even flimsier. Strong El Niño years since 2000: 2002, 2009, 2015, 2023. That’s four. Delete 2009 and the whole composite lurches five and a half days. I was building a narrative on a sample size you could count on one hand and still have a thumb free.
So the model set the ENSO weight to zero. In the code it’s a constant called ENSO_WEIGHT_OVERRIDE, sitting there at 0.0, with a comment above it explaining exactly why the sexiest variable in the building got benched.
The model deleted its own best feature. I did not want it to. It was right.
Which is, I think, the whole thing in one sentence: man builds model, model tells him to shut up, man publishes it anyway.
Why this is actually fine, physically
Once you stop being annoyed, it makes complete sense.
ENSO teleconnections in North America are a December–February phenomenon. That’s when El Niño reshapes the storm track. But the race to open is decided in October — and by December the whole thing has been settled for two months.
October openings don’t hinge on seasonal climate at all. They hinge on a handful of cold nights at 10,500 to 12,000 feet. That’s it. Can A-Basin run guns on East Wall for four consecutive nights? That’s a synoptic dice roll — a passing trough, a lucky Canadian airmass — and ENSO barely loads those dice.
El Niño will very likely matter enormously to the 2026-27 season. Powder days, base depth, whether March is any good. It just has nothing to say about who spins first. Wrong question, wrong timescale.
What the model found instead
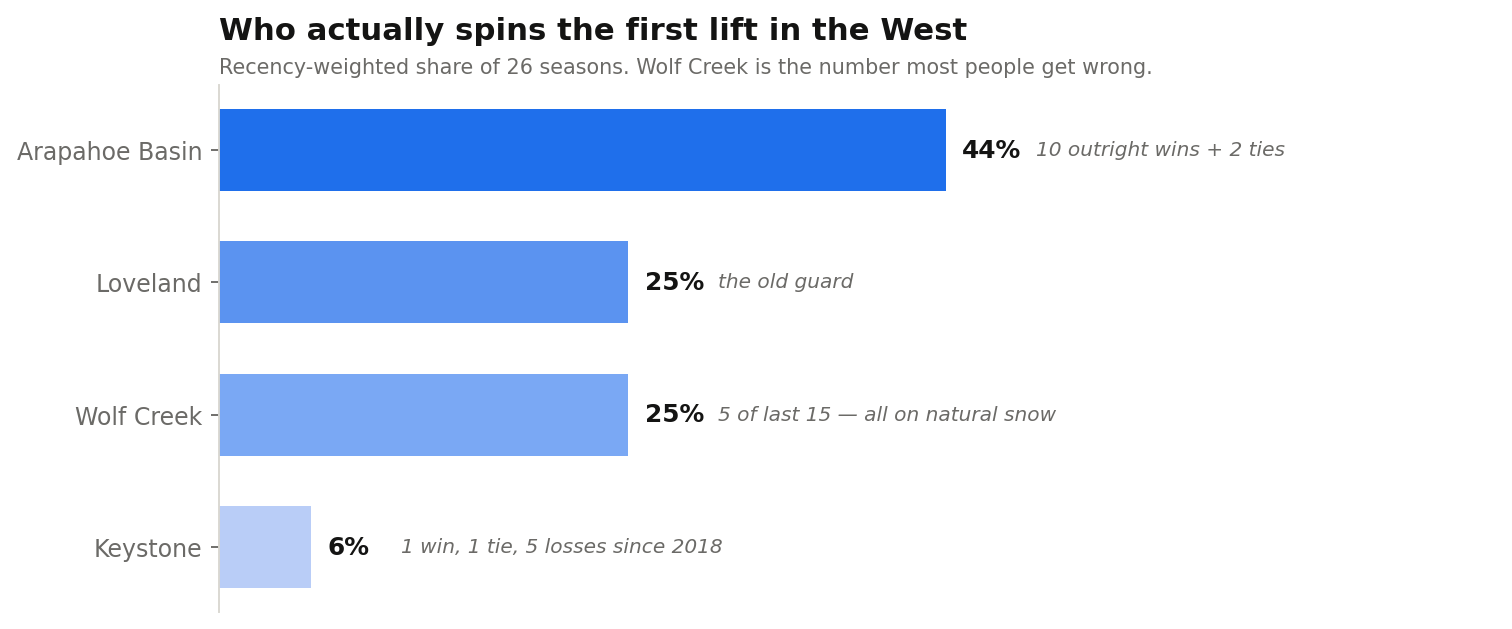
Wolf Creek is the number everyone gets wrong. I had it filed as a novelty — the occasional southern Colorado spoiler. Wrong. Wolf Creek has won 5 of the last 15 seasons, every single one on natural snow, and it holds the earliest opening in the entire dataset: October 8, 2011 — earlier than anything Loveland or A-Basin has ever managed with snowmaking. It’s not a spoiler. It’s a third force. The model gives it 25%, tied with Loveland.
Keystone is overrated by its own press. Vail’s money, real investment, and a genuine win in 2025 — and its record since joining the race in 2018 is 1 win, 1 tie, 5 losses. The model gives it 6%.
Everything is getting later, not earlier. Both regions drift later across the record — West mean October 15.5 → 20.0, East October 30 → November 2. Neither is statistically significant so I’m not leaning on it, but it runs directly against the “snowmaking arms race means earlier openings” story everyone tells. Warming Octobers appear to be eating the technology gains.
And my favorite piece of absurdity. Under a strict reading of “first lift-served skiing in the East,” the winner for three straight years is Ski Ward, Massachusetts — a 50-vertical-foot carpet hill running a one-day festival for five dollars. It has beaten Killington in 2023, 2024, and 2025. Killington’s “First to Open” branding is doing quiet, load-bearing work by pretending Ski Ward doesn’t exist. I’m honestly not sure who’s right. I’ve flagged it as an open decision, because it’s a definitional question and no amount of compute resolves it.
The hole I found in my own model
I said I’d come back to that 81%. Here’s the thing I got wrong.
The first version of this post said “nationally, the West opens first with 81% confidence.” Confident. Clean. Wrong — or at least, claiming considerably more than it had earned.
Because that 81% is not the probability that the West opens first in America. It’s the probability that the West opens before the East. Those are the same number only if the West and the East are the only two places in America you can ski.
The model has two regions. America has three.
I found this the way you find most real errors — not by looking for it, but by chasing something else entirely. I was searching for resort opening announcements and stumbled onto a list of national first-openings that didn’t match my data. Not because my dates were wrong. Because the winner wasn’t in my dataset at all.
Wild Mountain, Minnesota. A 300-vertical-foot hill in Taylors Falls that has been opening first in the Midwest for thirty-five years and, on the available evidence, has opened first in the country in at least two of the last fifteen seasons — beating my West’s actual winner by something like nine days in 2020 and five in 2022. It’s not a fluke. It’s a place with aggressive snowmaking, a low bar to clear, and no interest in waiting for Colorado.
My model doesn’t rank Wild Mountain low. It has never heard of it. The Rockies are in the West bucket, the Appalachians are in the East bucket, and the entire Upper Midwest falls straight through the gap between them — neither modelled nor explicitly excluded, which is the worst of both. A model that’s silent about a region isn’t being conservative. It’s just wrong in a way that doesn’t show up in its own error bars.
And note what this does to the Ski Ward joke above. I told that story as a cute definitional edge case — ha, a carpet hill beat Killington. But if you actually take the strict reading seriously, it’s not a cute edge case. It’s the whole answer. Under “first lift-served skiing in America, no asterisks,” the honest forecast probably isn’t Arapahoe Basin at all. It’s a rope tow in Minnesota. I’ve been building a model of the race I find romantic, not the race I said I was modelling.
So what did I do about it? Almost nothing, on purpose.
I didn’t patch the data. The source that surfaced Wild Mountain disagrees with my hand-verified rows by one to three days in several places — it has Wolf Creek’s record opening on October 11th when I have it documented at October 8th. A source that’s shaky on dates I can check doesn’t get to silently rewrite my dataset on dates I can’t. The structural point stands regardless of the exact days: a five-day gap and a nine-day gap both survive a ±3 day error. The specific dates don’t, so I’m not quoting them as though they do.
What I changed was the claim. “Nationally” came out. It’s P(West beats East) now, which is what it always actually was.
That’s the second time in one project the honest move was to make the model say less. I’m noticing a pattern, and I don’t love it, and I think it’s correct.
About that 34
Here’s why the confidence is low, and why I’d distrust it if it weren’t.
Roughly 15% of the variance is knowable in July. The base rate is the signal. Everything else is irreducible until October. The West’s 6.5-day standard deviation is the floor of what any July model can achieve — and this model is already sitting on that floor. Which means it is finished improving until new information physically comes into existence.
The 34 is the probability the headline call is jointly right on both week and location. Break it apart and it looks healthier: ~85 that the West opens in October at all, 74 that it lands within ±7 days of October 18, 44 that A-Basin is the one, and about 6 that October 18 is the exact day.
Six. That’s the honest number for a specific day, and anyone quoting you better without new information is selling something.
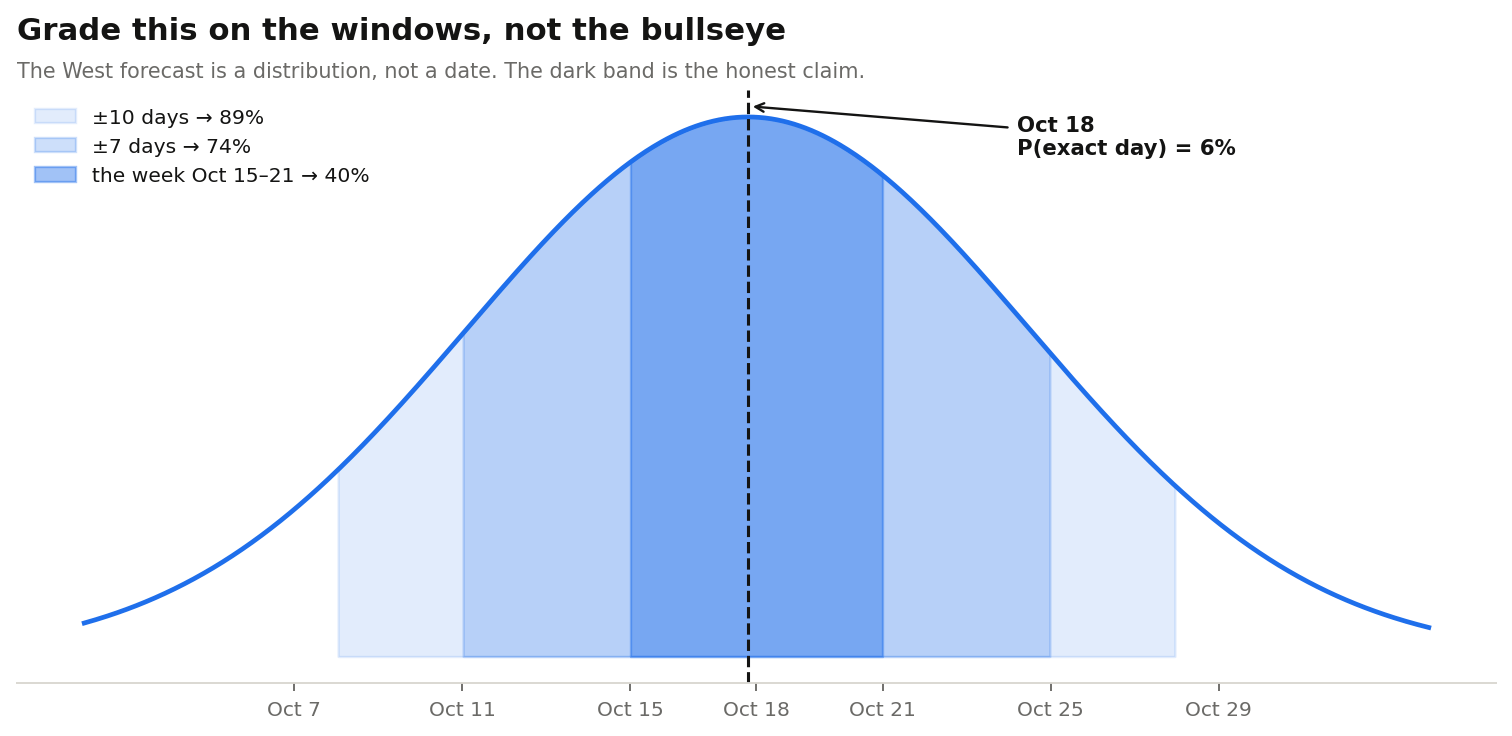
Grade this on the windows, not the bullseye. A ±7-day hit at 74% stated confidence is a success. Nailing October 18 exactly would be luck wearing a lab coat.
The updates I’m committing to
The model runs itself now. Weekly through September, daily through October.
And I’m committing to the boring part in advance: through September, the honest answer is “nothing changed.” The forecast should not move. The confidence should not move. If you see me publish a September update where the number mysteriously climbs, you should assume I got bored and started making things up, and you should tell me so.
The real information arrives in a rush around October 1st — snowmaking announcements, resort target dates, and finally 10-day forecasts for Loveland Pass that actually resolve the question. I expect confidence to jump from 34 to 70-plus in about 72 hours. Not before.
What would move it: a resort announcing a target date. Snowmaking guns firing. A forecast hard freeze at altitude. A big early dump in the San Juans sending Wolf Creek’s odds through the roof.
What would move it exactly zero: El Niño collapsing to neutral tomorrow. I’ve already checked. It doesn’t matter.
Then, in October, the season resolves and I find out if any of this was real. Every version of this model so far has been graded in-sample or by cross-validation, which is a polite way of saying it has never once made a prediction about a future it didn’t already know. October 2026 is the first honest test.
I’ll publish the grade either way. Including — especially including — if a 50-foot carpet hill in Massachusetts or a rope tow in Minnesota makes the whole thing look ridiculous.
Beat my model
Here’s the part I actually want.
34 out of 100 is a low bar. I have just spent two thousand words telling you exactly what this model knows, exactly what it ignores, and exactly where the hole is. That isn’t modesty. That’s a target painted on my own work.
So beat it. You don’t need Python. You need a date, a resort, and an opinion you’re willing to write down before the fact — which is the only kind that counts.
Leave it in the comments, or email it to BG@savagemountaincollective.com. Entries lock September 30, because after that it stops being a forecast and starts being a weather report.
Tell me why, if you want. And I mean anything. A regression. A hunch. Thirty years of watching Loveland’s snowmaking crew work. Your knees. I’m not being cute: a lifetime of pattern recognition at one mountain is a legitimate model, and it may well beat mine. CANTORE has 26 rows and no idea what East Wall looks like in October.
I’ll grade every entry the way I grade myself — on the ±7-day window and the resort, not the exact day. If you beat me I’ll say so, loudly. If a rope tow in Minnesota beats us both, that’s the funniest available outcome and I’ll say that too.
CANTORE lives here — the current call, the data, the charts, the update log, and the board of everyone trying to beat it:
→ savagemountaincollective.com/cantore
The model is climatology plus a verification layer that mostly exists to stop me from lying to myself. It’s about 300 lines of Python. It took a weekend and a frankly upsetting number of tokens to conclude “probably mid-October, like always” — which is what my wife would have told me for free.
But she couldn’t have told me it’s 74% within a week. And she definitely couldn’t have told me the El Niño doesn’t matter.
See you October 1st.
***Regards to Andy Cavacos, my high school statistics teacher, who would be shocked to find out I was actually paying attention.***
